
How do you picture the dynamic of Big Data? People use terms such as "game changer" a "new paradigm," "tectonic shift." Personally, I need a very big metaphor to capture the idea. I think it is futile to measure big data in terms of "potential annual value" as McKinsey does or by petabytes and zettabytes as others do.
When people ask me: What is Big Data anyway? I avoid mentioning tables, rows, columns; an internet of things; passive data or anything else in our lexicon.
I have found an interesting metaphor that is both profound and simple at the same time: Galileo's dark drawings of disks in space compared with Hubble's gargantuan worlds is a good metaphor for what is beginning to happen today with our explosion of Big Data. Comparing Galileo's 'universe' in the 1630s and our 'small' world as seen through Hubble's telescope conveys well the dizzying velocity, variety and volume of incoming data.
Galileo peered through a primitive telescope and saw blurry orbs in the sky from which he made rough drawings and great calculations that changed a world. He could not fully foresee where it would lead.
Likewise we know there are potentially both great and frightening things behind the veil of Big Data and ponder where it will lead.
Have a look at the images below and see if the comparison resonates with you. It's a visual metaphor only.
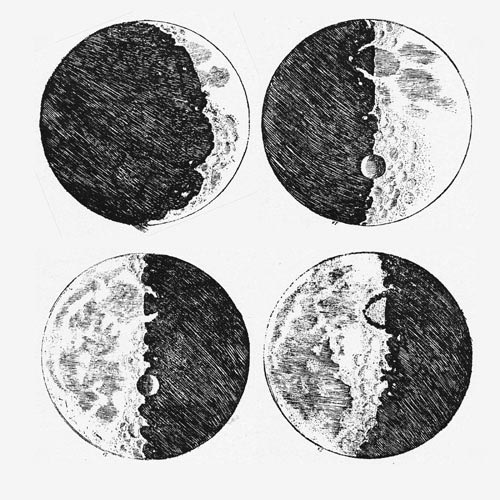
When Galileo drew these orbs, the data that made the Hubble picture below was around too--he just couldn't see it.

Big Data is our new Hubble, magnifying our view of life, if only to tell us how small we are.
Looking at the pictures above brings us to the next blog: data visualization. When you get beyond cherry picking data, cognitive bias, confirmation bias, and all the rest (see previous blog), how do you visualize the data for optimal expression? Next time.
No comments:
Post a Comment